Ah, Friends.
Each buddy is unique but have you ever considered the context of your relationships? Or their wider connection to the universe?
This month, we uncover friendship diagrams (FDs for short); A way to translate your connections onto paper using math and social science.
Let’s begin!
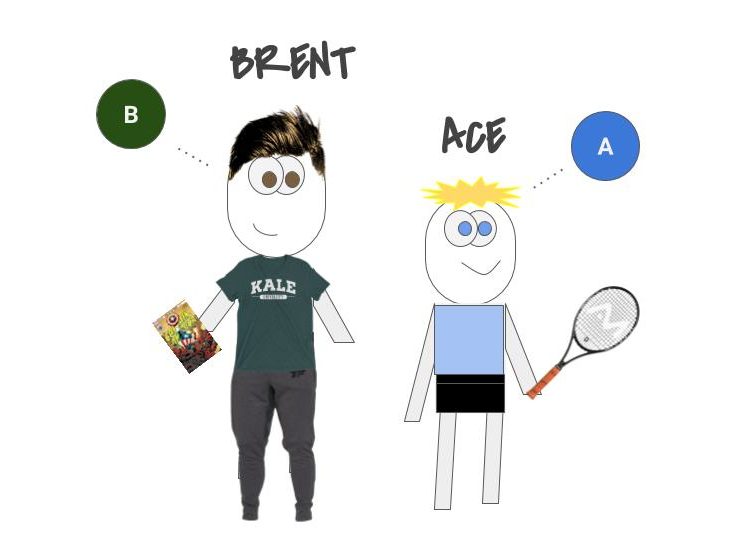
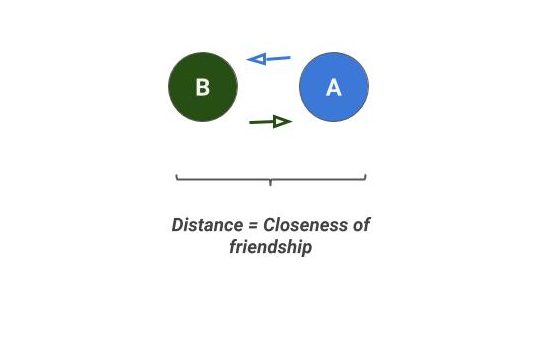
Meet Brent and Ace.
Each would independently call the other a “best friend.”
Translated into a Friendship Diagram…
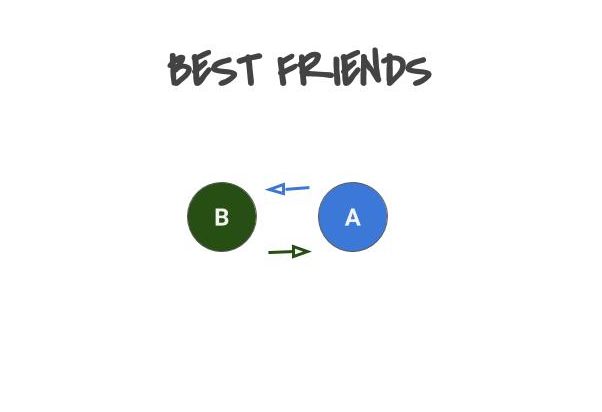
This visual has four components.
(1) Arrows show consensus
For Brent and Ace, it’s a two way street; they each agree a friendship exists between them.
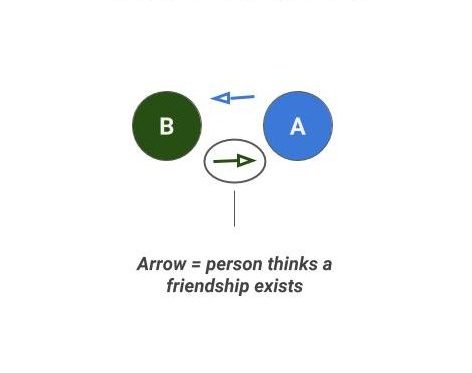
While subtle, it’s an important distinction because not all friendships go both ways. In fact, many do not.
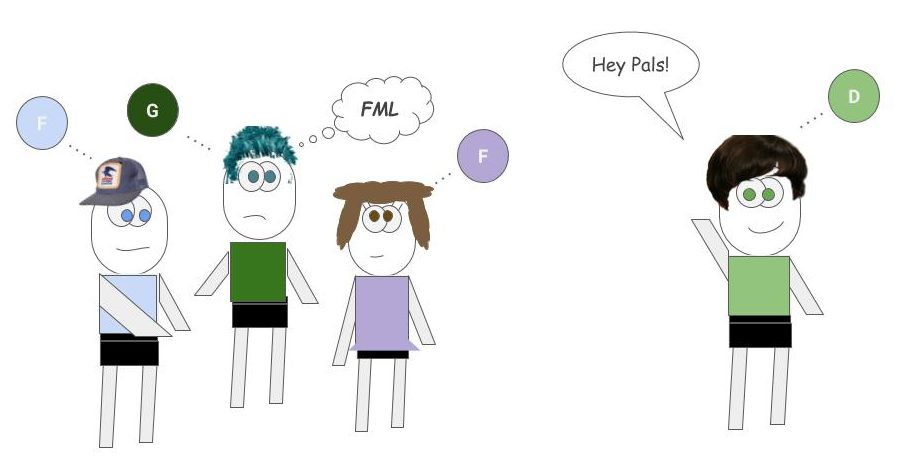
Meet Dirk.
Dirk is kind of a jerk, so nobody really likes him. Sure, you’ll be respectful when he’s around, but you don’t actually want to hang out with the guy.
…
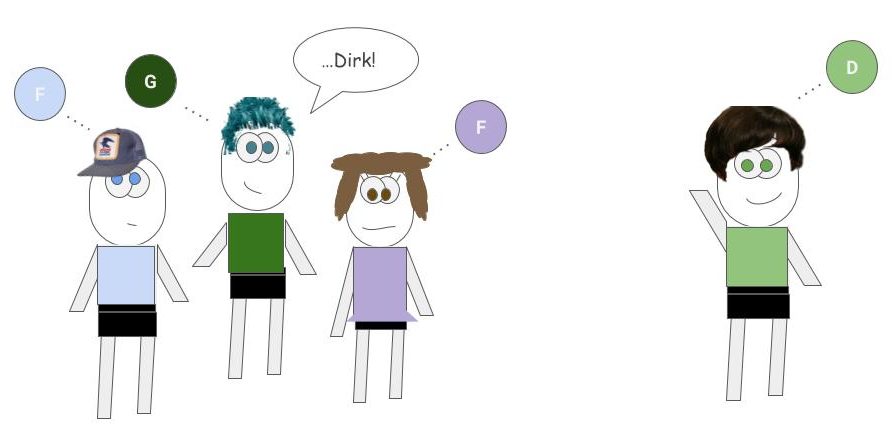
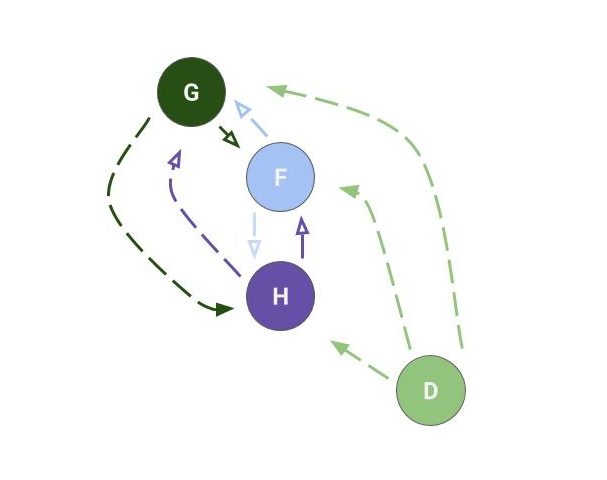
Dirk thinks everyone is his friend, but everyone else thinks differently. When we view his FD, Dirk has arrows going out, but sadly, none returning.
This is a crappy realization, but everyone knows a Dirk. In fact, at one point or another, we’ve likely found ourselves in our own Dirk-like scenario. While this is unavoidable, it could be worse.
Meet Steven Glansberg.

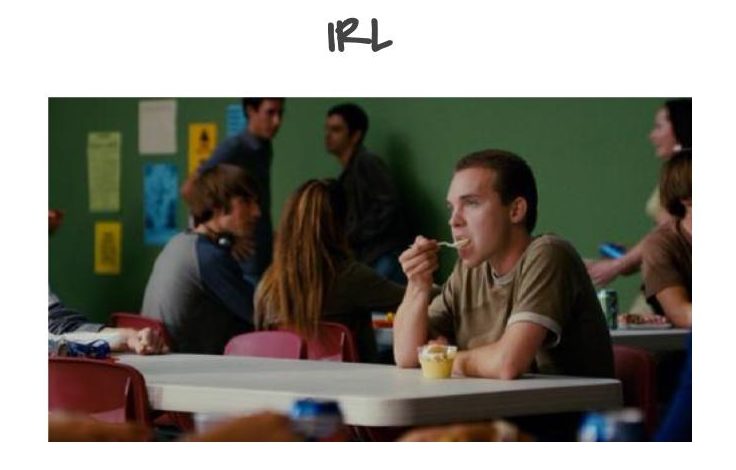
Video Reference: https://www.youtube.com/watch?v=_ZjH4wnzwk4
A noble mission: include the Steven Glansbergs and the Dirks.
(2) Proximity shows depth
Since Brent and Ace are best friends, it only makes sense that their proximity is close, but distance explains much more. How much do they know about each other? How often do they interact? Do they have similar social circles?
Bear with me, but the distance can be captured by an equation.
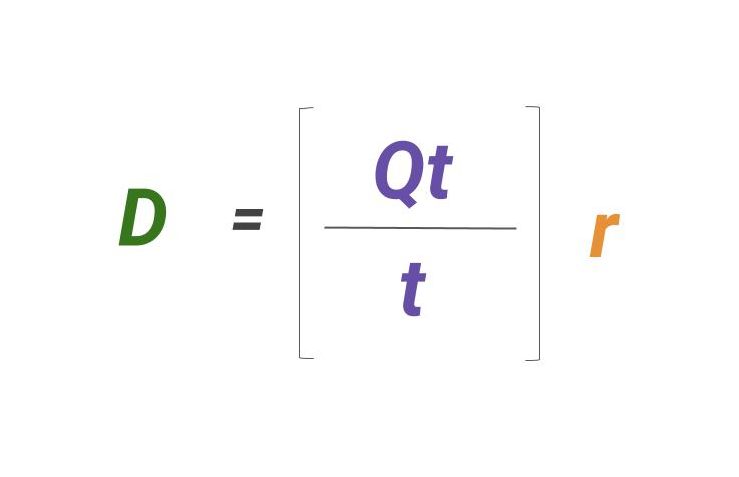
D = Distance on the Friendship Diagram
Qt = Quality Time spent together (life experiences and adventure)
t = Raw Time spent together (idle time and proximity)
r = Recency (how often you speak / last time you interacted)
The higher the score (D), the stronger your connection is, and the closer you sit on the diagram.
The purple bit of the statement describes our time.
Quality Time (Qt): When friends define how close they feel, it doesn’t have to do with their physical proximity. Instead, it’s described by how well two people know each other and the experiences they’ve shared together. For example, you may have a childhood friend whom you rarely speak with, yet you’ve grown up together. While your interactions are sparse, you’ve built a serious bond through the events that have shaped you, That’s Quality Time (Qt).
Time (t): In the same vein, there are those we spend time being around, but we’re not actively deepening relationships with. Think of the co-worker everyone dislikes, your child’s school teacher, even that crazy guy on the Subway. Time still counts towards something, but, when it’s idle or non-bond building, it pushes us away. That’s why Idle Time (t) sits in the denominator of the the equation. If raw time increases without any bond building, we’re slowly drifting apart.
We want to strive for the highest proportion of quality time together, because idle time eventually erodes our relationships. Consider your friendships; has your time together been quality or idle? When’s the last time you deeply interacted with your friends?
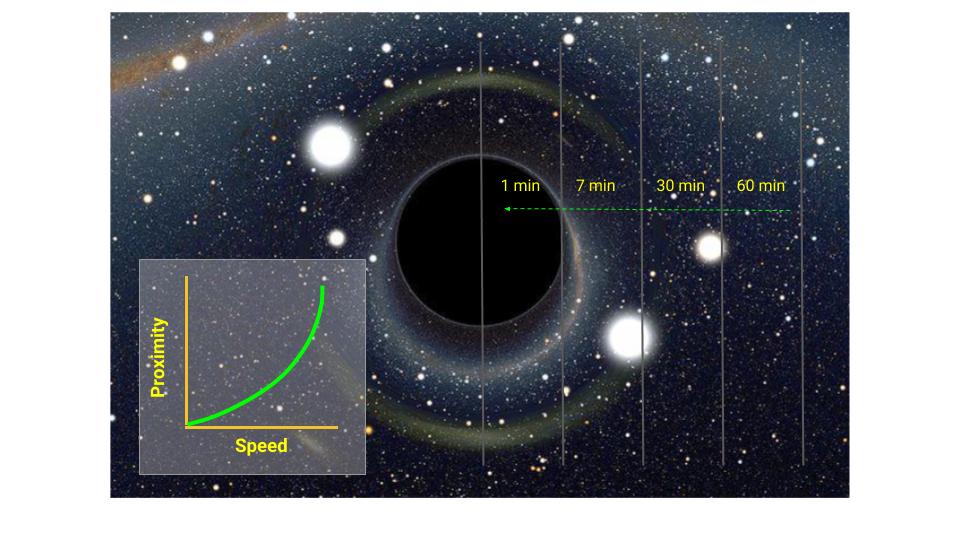
Recency (r): Just because you’ve built a strong connection, doesn’t mean you don’t need to maintain it. Keeping tabs on your buddies is not just additive but multiplicative. When we plan a fun night with friends, we tend to think of those we’ve interacted with most recently. And, if you’re out of the picture for a while, you can drop out of a friend’s immediate social channel quickly. This is why recency feels as if it’s on an exponential curve, but it’s not (see above). The truth is that you just need to take initiative. When we proactively reach out, we resume our closer proximity… just don’t wait too long.
Have you been missing in action lately? Check out this post on how to deepen relationships in the 21st century. (Hint: While it may feel hard, it’s easier than ever to stand out).
If you break down the math you’ll find that Quality Time (Qt) and Recency (r) are the biggest drivers of Distance. Meaning that the fast lane to building a friendship is to spend time purposely with one another on a more frequent basis. There could be an entire post written on this subject, but to keep it simple: discover shared interests, make plans, and show up.
Cool, we’ve learned distance! Now grab your astronomy boots, because we’re going planetary next.
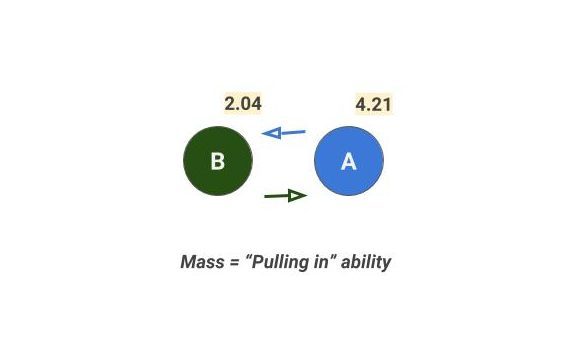
(3) Mass shows power
Mass is your weight after you strip away gravity (aka: the force holding us down on Earth).
But the coolest part about Mass is that it shows us how different bodies interact [1]. The greater a planet’s mass, the more it pulls in other objects around it. Take the Sun and the Earth. It’s estimated that you could fit 1.3 million Earths inside the Sun.
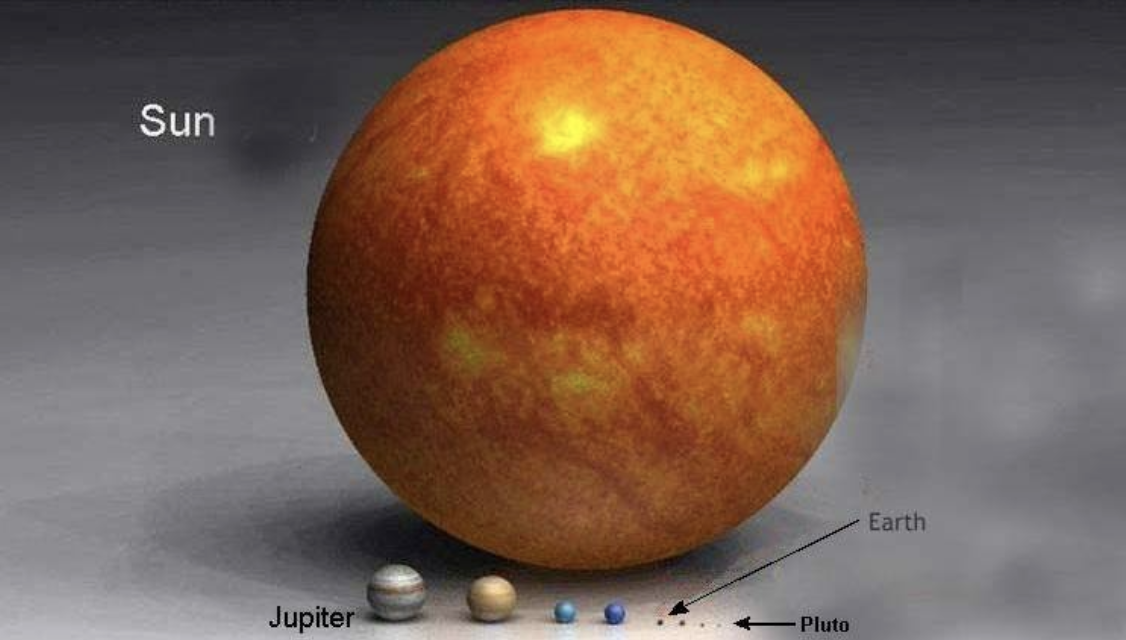
The Sun is 333,000 times more massive than the Earth. Because it’s so large, there’s an invisible force pulling all the planets in our solar system towards the Sun at all times. This is why the Earth rotates around the Sun and not vice-versa (sorry Aristotle!).
I posit that our friendships experience the same phenomenons; Friendship Diagrams are like mini-maps of our own universe.
First off, we can denote each person’s Mass; illustrating the ability of an individual to pull others inward, and keep us together. Just like the periodic table of elements, there is a wide range of Mass out there, or, in this case, “pulling in strength.”
But there’s a second quality of Mass; the more massive an object, the harder it is change its state of motion [2]. In the case of FD’s, motion isn’t physical, but is a person’s opinions, attitudes, feelings, and decisions to be friends.
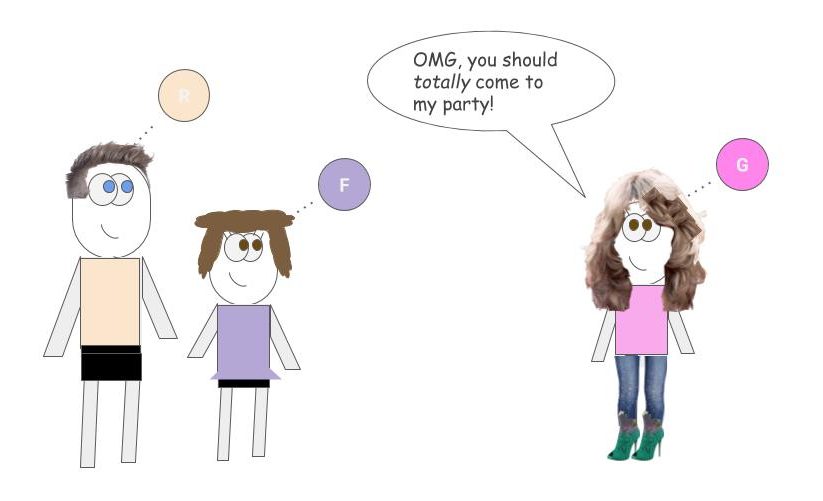
Take Grace, as an example.
…
…
…
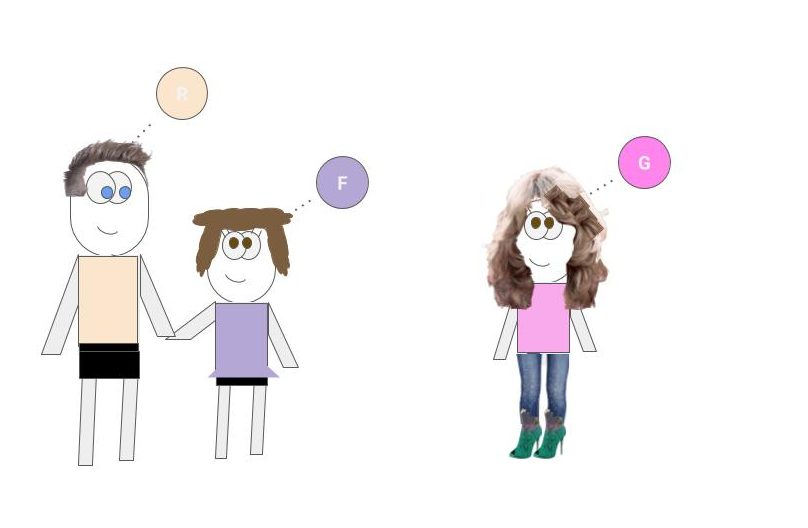
Hangout with Grace once, no big deal. But make it a weekly occurrence, and she’ll suck you right in. Before you know it, you can’t escape Grace; she’s everywhere you go, socializing more than breathing, hanging out with your friends.
Want to go bowling? Oh, hey Grace…
Trying to see Avengers alone?
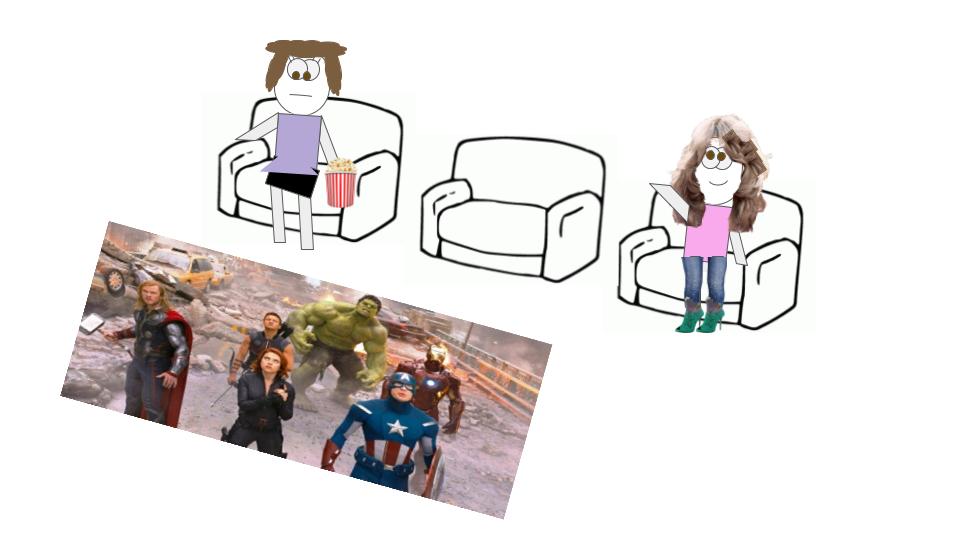
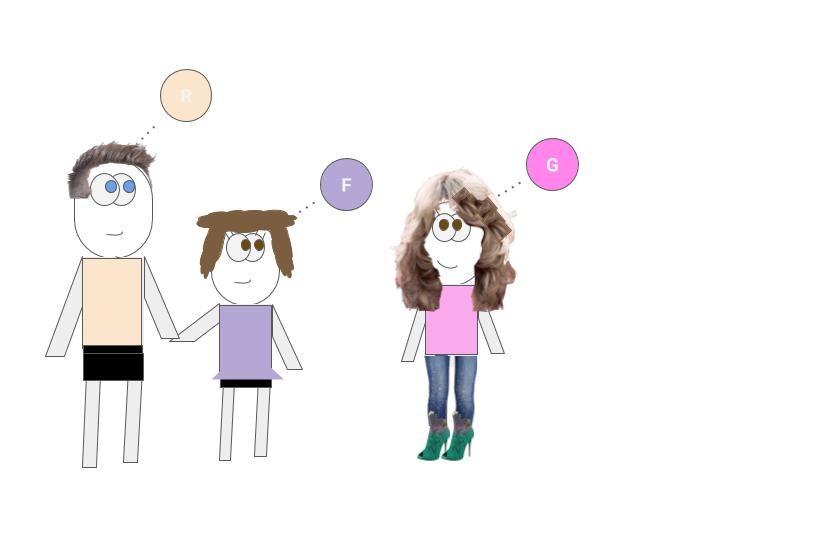
Soon, you can’t make plans, because Grace has already made them for you.
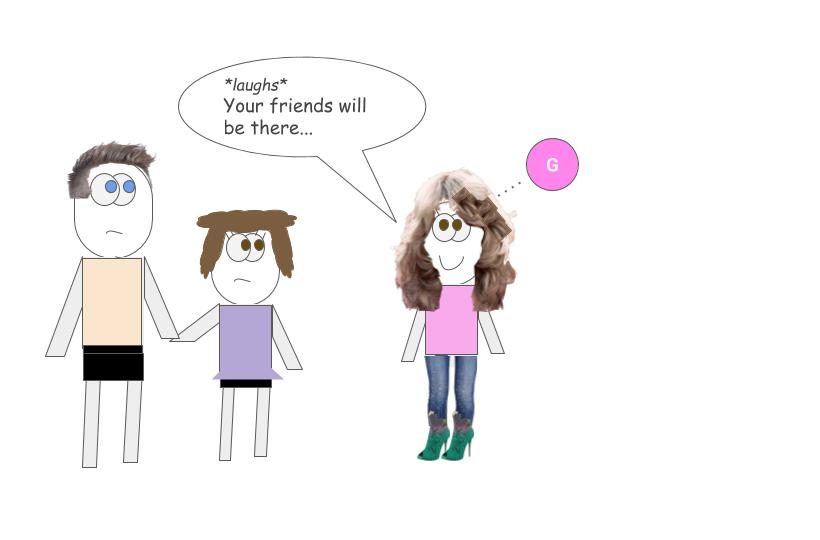
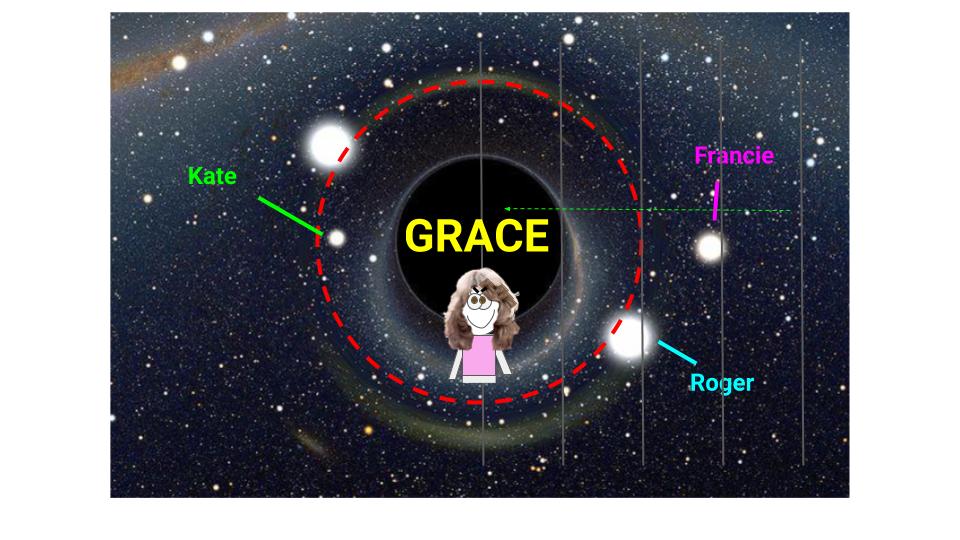
Grace is the blackhole of friends.
And there are two things we know about Black Holes.
#1. The speed of sucking you in accelerates as objects get closer towards the center.
#2. Once you pass “the point of no return” (Schwarzschild radius), you can never escape [3].

Together, this forms a massive Grace.
There are positive versions of this phenomenon, but the main point is to be careful. Our social circles exhibit an abundance of forces, and you can drift far without realizing it.
Have you wandered off course?
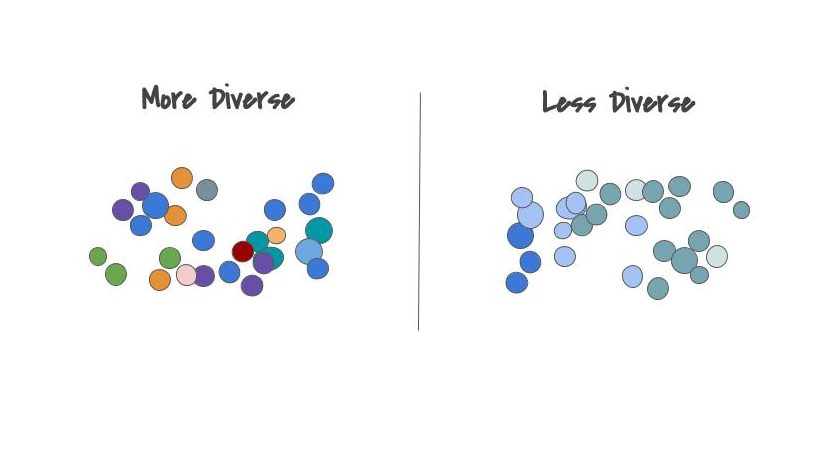
(4) Color shows uniqueness
Lastly, while Brent and Ace have similar interests, they are unique people. To illustrate their differences, they are distinct colors.
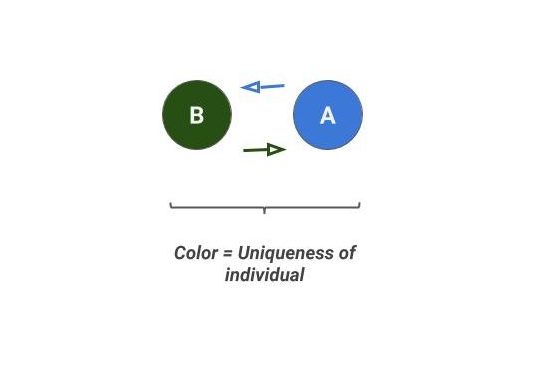
When we talk about color in the friendship diagram we mean informational differences, like their education, experiences, values, and goals.
-
- Brenton grew up in the South, he’s from a rural town, and studied Writing in college.
- Ace grew up in the North, he’s from an urban town, and studied Business in college.
Small differences, large shifts in viewpoint.
This attribute is powerful, and we want to aim for a colorful Friendship Diagram of our own.
Adam Grant has a good explanation of why diverse backgrounds and viewpoints matter:
“You want teams that are cognitively diverse and psychologically safe. A variety of thinking styles—coupled with the freedom to take risks without being punished—enables groups to generate, test, and implement creative ideas. It’s important that our diagrams grow diversely, and we give them the freedom to fail.”
Think about the internet, would you agree that (when used properly) it can elevate performance? There are a variety of reasons why that may be so, but the internet provides an unfathomable number of data points (many of them being different). While these articles, opinions, and interests may not be relevant or even true, they create new pathways of thought that challenge our decisions. Ultimately, we may only use a small percentage of the data, but having access to unique opinions gives way to the best outcomes – it fights against the echo-chambers of our own selves. Here’s a study from Stanford further explaining this concept.
Of course, it’s easier to relate to colors that are similar ie: those who have similar backgrounds or experiences. However, we must push ourselves to create relationships with those less like us as too. Performance outcomes are elevated when we increase diversity [2]. And of course, digging deeper we actually find that we are more alike than different.
“Human beings by nature want happiness… everyone tries to achieve [it]. In this way, [we] are the same, whether rich or poor, education or uneducated, Easterner or Westerner, believer or non-believer, and within believers whether Buddhist, Christian, Jewish, Muslim and so on. Basically from the viewpoint of real human value we are all the same.”
-Dalai Lama
We’re all some sort of dot on the friendship diagram, whether our dots are big, small, blue, or green.
< END of Part 1 >
Coming up next, our FD over time and more.
Which attributes do you relate to most?
Post your comments below.