There’s a divide on the horizon, and it’s unlike ones we’ve seen in the past.
When we use the word “divide” to describe a phenomenon, it usually refers to access; one group of people has access to a resource, while a second group does not. We’ve seen this around the world with clean water, education, and nutritious foods. If you happen to be born in a country that doesn’t have one of these resources (or a limited supply of one), you’re at a disadvantage and there’s not much you can do about it – tough luck.
But today we’re looking at a different divide, one which I believe will be synonymous with the 21st century. It has to do with access, but in a completely new way.
I call it, “The Next Divide” and it’s a digital one.
Chapter 1: Active vs Passive
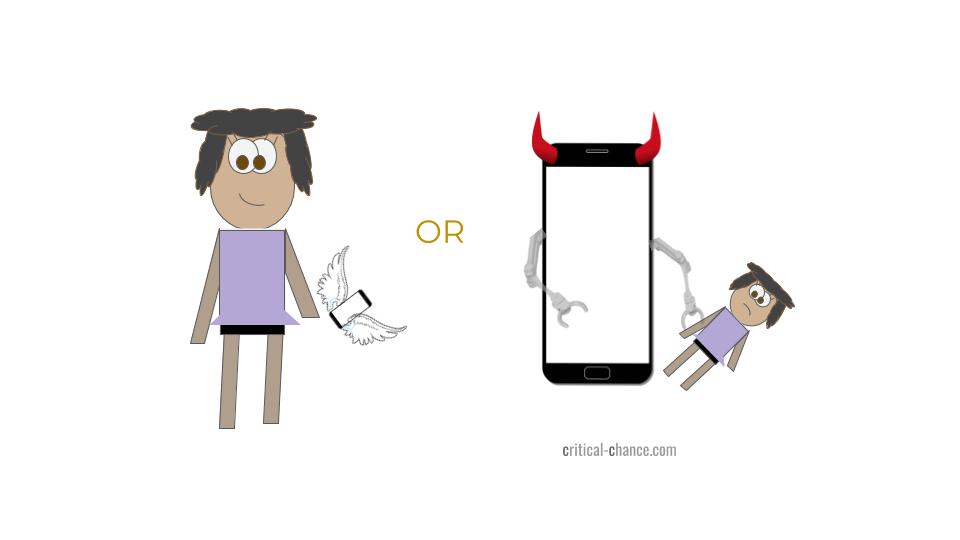
Are you using your phone, or is your phone using you?
We live in an amazing time. Your phone can retrieve endless quantities of entertainment, social connection and knowledge.
Consider for a moment that you’re able to travel back in time to 1980. You encounter your 1980’s doppelgänger self and you do your best to explain smartphones in 2019.


Let’s face it, we tend to spend a large portion of our time surfing our phones without meaningful intent. This isn’t completely our fault, it more has to do with the implicit relationship between you and your phone.
While your phone offers you endless possibilities, it comes at a cost. Instead of money, most apps demand something else: your time and attention.
New-age business models
Internet companies (and many smartphone apps) make money by keeping you on their products longer. They do this by monetizing their products through online advertising, which directly correlates with engagement and time spent on their website. The more they know about you, the better they can convert your data into cash.
Question: What happens when our most valuable businesses operate in this way?
Answer: Our most brilliant data scientists and software engineers are being taken from every other industry to work on the same objective: keep you online longer.
According to Tristan Harris, a “design ethicist,” the problem isn’t that people lack willpower; it’s that “there are a thousand people on the other side of the screen whose job it is to break down the self-regulation you have.”
While you’re scrolling through Instagram, there are thousands of MIT, Harvard, and Berkley engineers running multivariate tests, all to determine the best way to break down your self-control and keep you on their app longer.
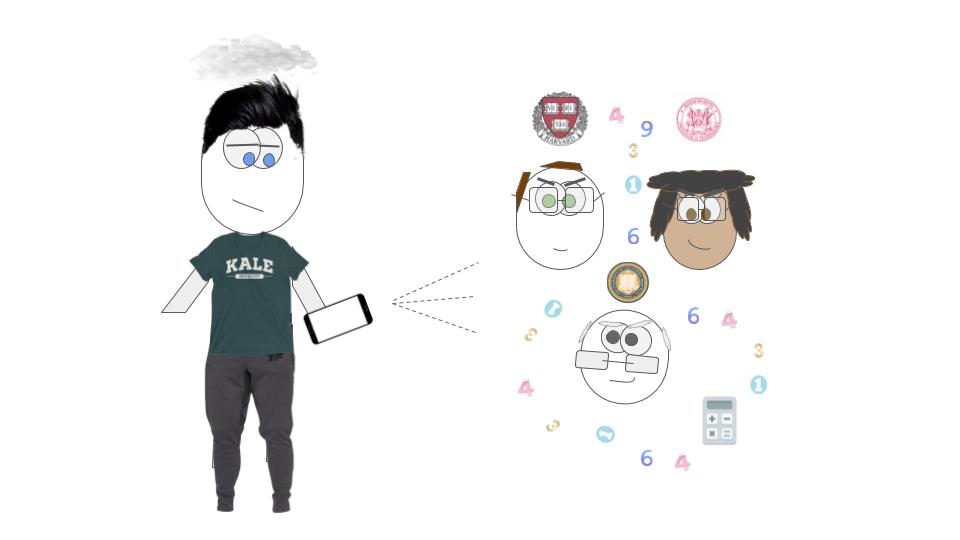
Personally, I find myself being used, all the time.
Last week, I decided to open Instagram to see what my friends were up to. My intention was to scroll for 5 or 10 minutes, but 30 minutes later I caught myself mindlessly watching puppy video clips. The power dynamic shifted because I was no longer making the choices.
For the first five minutes, I was in control of the content, but soon after Instagram took over by deciding what to put in front of me. Facebook had been battling for control over my attention, and it had won.
Digital and online for that matter, isn’t a story of all negatives, there are positives too:
When I was 18 I received a guitar as a gift. Before then my involvement in playing instruments was limited, however learning guitar was a cool aspiration I’d always had. Unlike generations before me, I shrugged off formal training, and instead took to YouTube for lessons.
Between the hundreds of videos and endless practicing, I learned how to play guitar and still do today. Sure, that took discipline; I played for at least an hour everyday after school, but there were far less distractions back then.
This is just one small example; there are millions of people who have elevated their musical ability through the type of lessons the internet can provide. If you take a step back and consider this idea, you’ll recognize that people are applying it to all areas of expertise (ie: coding, art, history, the list goes on).
So ask yourself, who really has the power in your tech relationship? And further, are are you trading your asset (time and attention) at a positive return? Or perhaps the technology has the upper-hand?
Summary: The 21st Century has created a new tier of human potential, but the question is…
Chapter 2: Which Group Are You In?
While technology is accelerating our ability to achieve amazing intellectual, creative and productive feats, it’s ability to distract us is accelerating at an equal clip. You can’t go a day without being inspired, yet so distracted at the same time. It’s these conditions that make the digital divide possible.
Sometimes success is 3% brains and 97% not getting distracted by the internet.
Shane Parrish
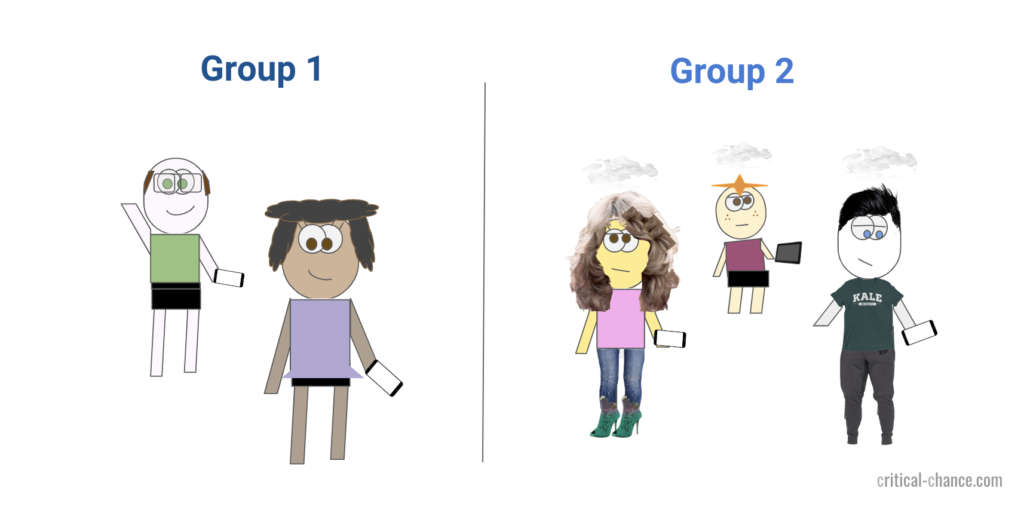
The digital divide will create two groups:
Group 1 is able to control their focus and leverage technology to improve themselves, and moreover, reach greater potential.
[Technology] is a great way to automate a habit. You can save for retirement with an automatic deduction from your paycheck. You can curtail social media browsing with a website blocker.
Technology can transform actions that were once hard, annoying, and complicated into behaviors that are easy, painless, and simple.
It is the most reliable and effective way to guarantee the right behavior.
James Clear
Meanwhile, Group 2 is trading their time for mindless surfing. Their behavior is not only distracting themselves from the world around them, but it’s also causing them to achieve less.
And technology can rewire our brains.
The Sleeping Scientist
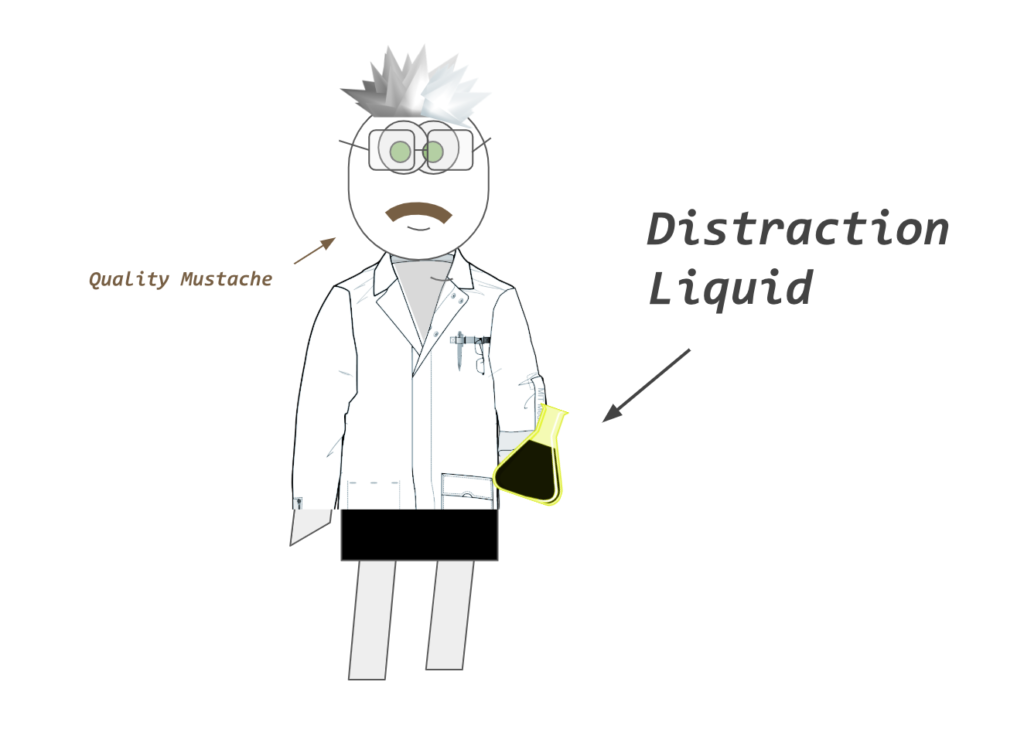
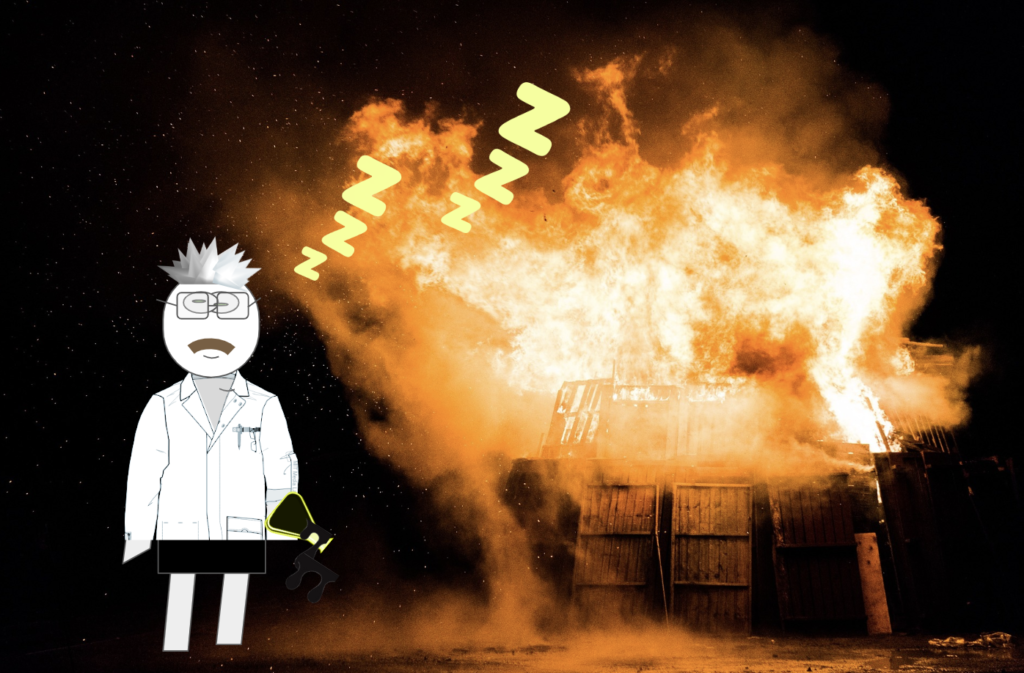
We each have a little scientist named Hank, who manages a lab within our brain. It’s Hank’s job to control your focus, and he does this by balancing your distraction liquid 24 hours a day, 7 days a week.
There’s a constant replenishment of distraction at all times; your thoughts wander as new stimuli enter and exit your external environment.
Some people are born with more liquid than normal, others develop habits which increase their exposure over time. Ultimately, you train your Hank to manage his beakers in the best way possible. My personal favorite strategy is meditation.
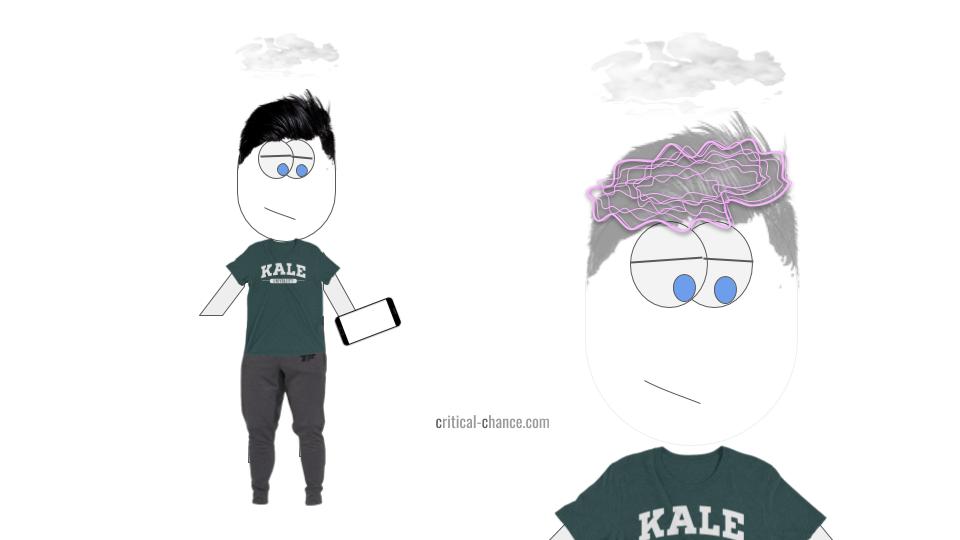
But the crux of the problem is that digital applications are training your Hank to be irresponsible. Have you ever sat down to work on something, only to find yourself distracted 10 minutes later? What about open your phone to do something, and then completely forget?
That’s your Hank falling asleep in the lab, and when Hank doesn’t pay attention, he causes leaks and spills.
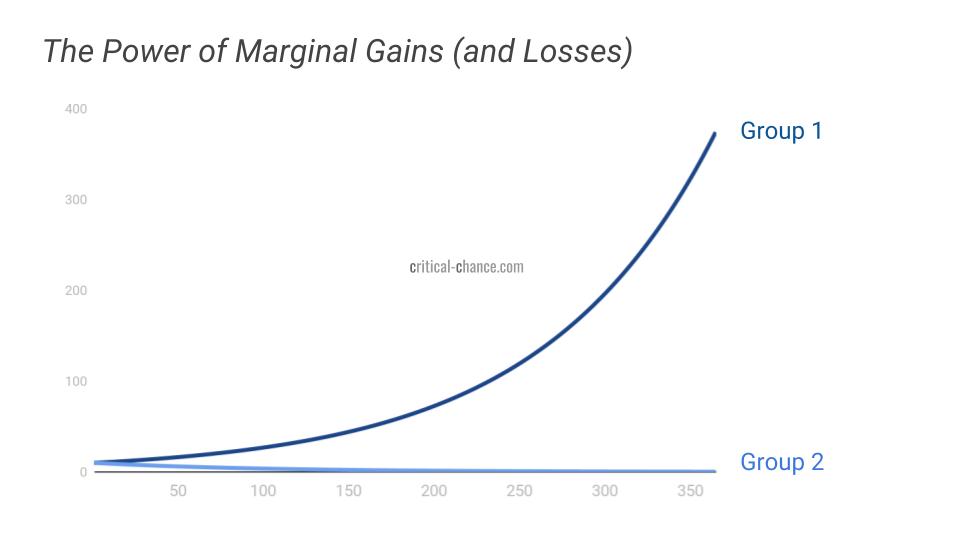
Here’s what distraction looks like:
Small naps lead to extreme compounding. . One laboratory spill leads to a broken beaker, which leads to less liquid control in the future. Lab explosions move from a rarity to a constant affair in your head.
So over a short period (1-2weeks), the difference is marginal. However as the time series extends further, the differences become insurmountable.
I’ve written about the power of compounding many times; Albert Einstein dubbed it as one of the greatest wonders of the universe. Talk about a bold statement, especially from a man who revolutionized modern day physics (and astronomy).
Summary: Whether you’re in Group 1 or Group 2, will become a life-changing characteristic.
Over the next ten years, this macro trend will lead to enormously disparate outcomes. Great or terrible, it all depends on which group you fall into.
Chapter 3: The AI Revolution
We’ve now established that access (per the traditional sense) isn’t the problem; each group can connect to the internet at relatively similar speeds. Instead this divide focuses on the way in which people leverage the internet (use the resource).
Enter Artificial Intelligence, aka: the great accelerator.
AI is a comprehensive subject, so I’m going to over-simplify a bit here. If afterwards readers have greater interest in the mechanics, I can write up a separate blog post. But for now, let’s just say there have been some major advancements in the field.
Once of the largest breakthroughs is around this idea called deep learning.
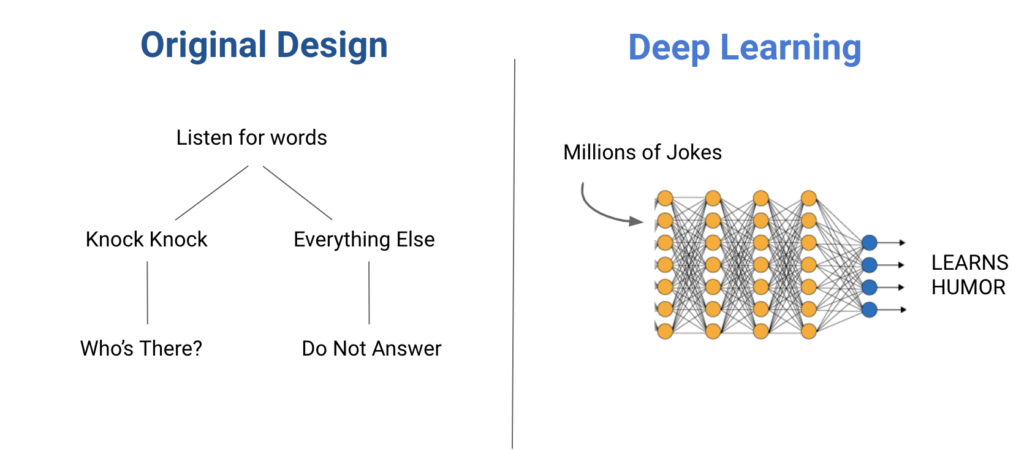
Previously you could only train a computer to follow a set of rules (or simple algorithms). You would tell a machine that if it hears the phrase, “Knock, Knock” it needs to answer, “Who’s there?” Any variations from “Knock, Knock” and the computer not be able to respond.
Now, with deep learning, we can give the computer a massive set of data (in this case jokes) and train it to learn humor. Scientists watch it learn in real time and correct it whenever it makes a mistake. After lots of data and repetition, it eventually “learns” the idea.
Mechanically the computer forms connections just like how our brains do. These are called neural networks, and to get a better visualization of how these systems work, you can check out the Tensorflow Playground.
What does this mean for the Digital Divide?
AI is (already) learning your behaviors, tailoring content, and therefore be able to break you down significantly further.
Remember those thousands of MIT graduates running multi-variate tests? Now imagine if they programmed a super-computer with more power and genius level pattern recognition. They will now discover things about you that were unfathomable with humans experimenting alone.
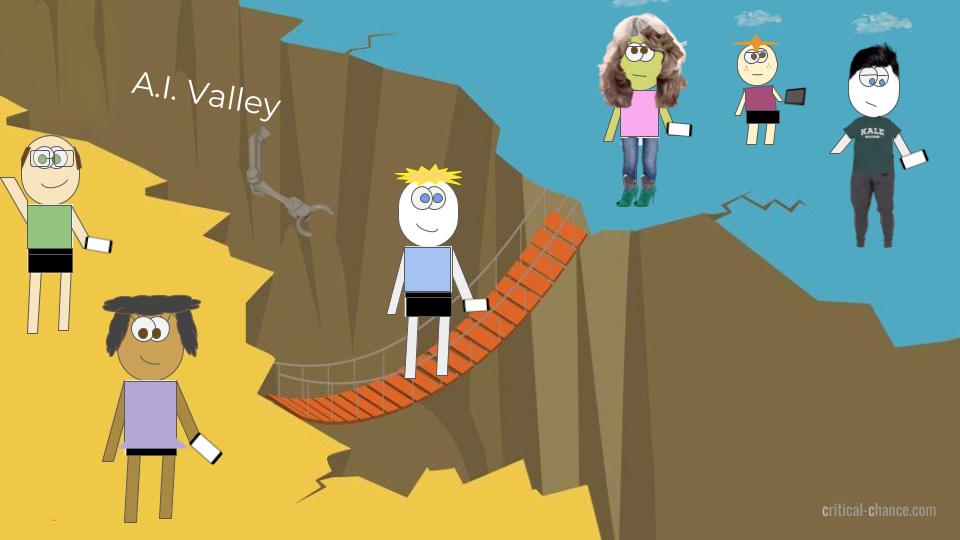
Summary: AI is forming a massive crater in the ground, and it is going to push the two groups further apart.
It will be on us to make sure there are enough formidable bridges to provide opportunity for those stuck on one side, however more likely than not, AI Valley will destroy your hopes of crossing… if you wait too long.
Conclusion: Big Distractions or Big Dreams?
I believe these gaps will be filled over time, but it’s going to take time and large innovations in technology.
Right now companies are making money off of your time and attention, so there’s no incentive to turn a passive person into a more active person. Yet, if we want to grow to our total potential, we need to flip the script and change the way we use our attention ourselves.
Which side of the digital divide will you be on?
The earlier you decide, the more you’ll gain.
“Don’t be on your deathbed someday, having squandered your one chance at life, full of regret because you pursued little distractions instead of big dreams.”
― Derek Sivers
Will you chase your dreams?
This post was inspired by:
Irresistible: The Rise of Addictive Technology and the Business of Keeping Us Hooked by Adam Alter
The Four: The hidden DNA of Amazon, Apple, Facebook and Google by Scott Galloway
The Future of Happiness by Amy Blankson
The Coddling of the American Mind by Jonathan Haidt and Greg Lukianoff
Essays by Tristan Harris
